
March 01, 2018
Fourth Quarter GDP
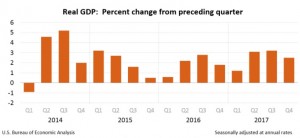
Real gross domestic product (GDP) increased at an annual rate of 2.5% in the fourth quarter of 2017, the Bureau of Economic Analysis reported on the 28th February 2018. This was a .7% decrease from the growth rate of 3.2% reported for the third quarter in 2017.
The deceleration in real GDP growth in the fourth quarter reflected a downturn in private inventory investment that was partly offset by accelerations in personal consumption expenditure (PCE), exports, state and local government spending, non-residential fixed investment, and federal government spending, and an upturn in residential fixed investment. Imports, also increased, offsetting improvement in the above mentioned items.
However, the increase in real GDP in the fourth quarter can be explained by positive contributions from personal consumption expenditures (PCE), exports, non-residential fixed investment, residential fixed investment, state and local government spending, and federal government spending. These positive contributions were partially offset by a negative contribution from private inventory investment and an increase in imports, which are a subtraction in the calculation of GDP.
Nominal GDP (ie., GDP not adjusted for inflation), increased 4.9% or $235.9 billion in the fourth quarter to a level of $19,736.5 billion. In the third quarter, current-dollar GDP increased 5.3%, or $250.6 billion.
Annual GDP 2017
Current-dollar/(nominal) GDP increased 4.1%, or $761.7 billion, in 2017 to a level of $19,386.2 billion, compared with an increase of 2.8%, or $503.8 billion, in 2016.
The price index for gross domestic purchases increased 1.8% in 2017, compared with an increase of 1.0% in 2016. The PCE price index increased 1.7%, compared with an increase of 1.2%. Excluding food and energy prices, the PCE price index increased 1.5%, compared with an increase of 1.8%.
Company Disclosure -The information contained herein has been obtained from sources believed to be reliable, however its accuracy and completeness cannot be guaranteed. You are hereby notified that any disclosure, copying, distribution or taking any action in reliance on the contents of this information is strictly prohibited and may be unlawful. Mayberry may effect transactions or have positions in securities mentioned herein. In addition, employees of Mayberry may have positions and effect transactions in the securities mentioned herein.


